An Excel-Driven Exploration into Deciphering Bike Purchase Patterns
This project was another first for me—my first Spreadsheet project. It was a bike sales analytics and it went a long way in helping me master my way around Excel. The challenges it brought were exciting especially in the process of creating the dashboard to bring together all my visualisations. The purpose of this project was to unravel the factors that influenced the customer’s decision to purchase a bike. This analysis explored a rich dataset, shedding light on insights through data processing and visualization.
Data Collection
This dataset I used was brimming with customer-centric features related to the factors that influence the customer’s decision to buy a bicycle. These features include ID, Marital Status, Gender, Income, Children, Education, Occupation, Home Owner, Cars, Commute Distance, Region, Age, Purchased Bike. I got this bike purchases analysis from a data analyst's YouTube channel where he performed the analysis on Excel spreadsheet. I replicated the analysis and visualization also using Excel spreadsheet.

Data Preparation and Cleaning:
The dataset was in CSV format which I imported into the Excel worksheet. I removed duplicates from the data, to ensure data integrity, and prepare it for further analysis. Upon exploring, the dataset had no nulls or empty data, or outliers.
Feature Engineering and Enhancement:
For easy understanding, I used the "find and replace" function to replace the M and F values in the gender column to Male and Female respectively. I also changed the M and S in the Marital Status to Married and Single respectively. Also, I converted the column containing income to Currency, and reduced it to two decimal places. I also created a new column called "Age Brackets" in which the ages of the customers were grouped into corresponding age brackets using the Nested IF function. The brackets were Youth for people below 31; 31 to 54 were Middle Age; and Old was used for people who were 55 years and above.
Pivot Tables and Summaries:
The pivot tables were used as gateways to insights, encapsulating summaries I believed were essential to understanding the bike purchase dynamics. The pivot tables contained summaries of counts of Commute Distance, Age Brackets, Education against Purchased Bikes to crystallize the influential columns.

Visualizations and Insights:
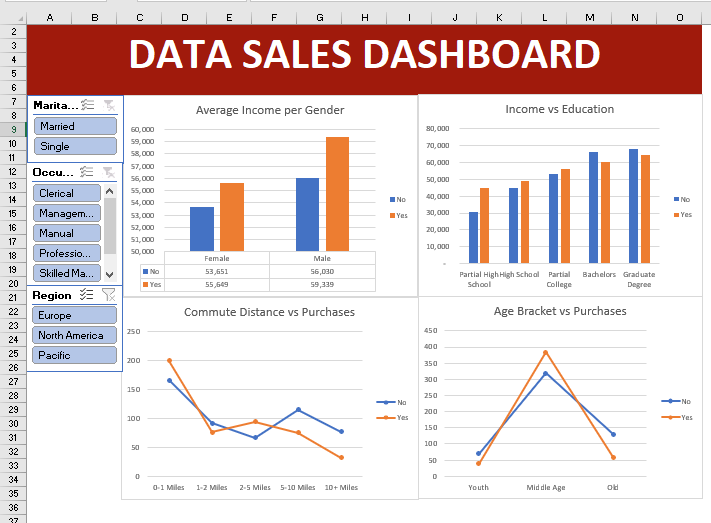
In the realm of visual storytelling, I used column charts and line graphs to illustrate each pivot table. They easily conveyed how each of these variables—gender, education, commute distances, and age brackets—intricately shaped customers' purchase decisions. For my dashboard, I created a new sheet and brought in all my visualisations. The charts and graphs were augmented by slicers and filters that offered insight into specific variables' impact such as region, marital status and occupation.
Analysis Findings:
The fusion of analysis and visualization unveiled intriguing revelations. The primary contributors to bike purchases were a demographic of males with incomes above $59,000. It also included people with education above high school, commute distance of 0-1 miles, and nestled within the middle age bracket.
Conclusion:
What stands out to me in this Excel-driven bike sales analytics is that it not only deciphered patterns but uncovered a roadmap—a map that highlights the distinct variables steering customers toward bicycle purchases. In analysing bike buying behaviour, this project helps to underscore the need for data-driven insights that pave the way for informed strategies and targeted approaches in the realm of bicycle retail and marketing.



Comments